Stock Charting Software allows you to understand the financial landscape better. It enables you to study and analyze the trading behavior of particular stocks, currency pairs, and even commodities.
So, it pays the way for making or even growing your income.
Here, we have featured 10 Best Stock Charting Software Free & Paid so that you can understand the market movements better and grow your income.

However, before we head over to the list of Stock Charting Software, let’s understand the concept behind stock charts.
Contents
What is a Stock Chart?
A stock chart is a price chart that shows stock price action, which is plotted over a timeframe, along with other important information.
Here, the timeframe that is used for forming the chart can be hourly, daily, weekly, monthly, quarterly, and annually.
It is important to note that traders make use of charts that are made up of daily and intraday data for forecasting short-term price movements.
On the other hand, investors make use of daily, weekly, and monthly charts for tracking long-term trends and for forecasting long-term price movements.
A stock chart exhibits the price change at which the stock was being traded during the time period, along with the opening price (the price of the first trade), the highest price at which the stock traded during the time period, lowest price of the stock during the time period, as well as the last price at which the stock was traded.
So, you can come to know about the net change.
For example, if you’re looking at a daily stock chart, you can come to know about the day’s price change compared to yesterday’s closing price.
So, if stock experienced positive change, it would be reflected in the form of the candle, which can be green for positive closing or Red for negative closing.
Thus, a stock chart shows price data (open, low, high, and close prices) over a specific period.
In fact, there are three basic chart types:
- Line Chart: It is used to plot the closing price of a stock. It allows you to see how the stock price is behaving so that you can identify certain price barriers.
- Bar Chart: It is of two types: OHLC & HLC.
OHLC tracks all 4 price points: Open, High, Low, and Close. HLC tracks only 3 price points: High. Low and Close. It helps identify the prevailing trend so that you can time the entry and exit of your trades. - Candle & Stick Chart: It uses the 4 types of price data, thereby giving you a better representation of the price action.
Here, the “body” represents the price range between the open and close.
For instance, when the close is higher than the open, the body of the candle will be green. However, when the close is lower than the open, the body of the candle will be red.
A stock chart also shows the volume (amount of stock) that is bought and sold within a specific period. When a stock tends to move on low volume, it means that few people are participating in the current price movement. This indicates that the trend is not likely to continue.
However, when a stock moves on the high volume, it means that many people are involved in the trade. This indicates that the trend is more likely to continue.
When you see a spike in volume, it shows that the trend is about to change.
Now that you have understood what a stock chart is, it’s time to move ahead and explore the list of 10 Best Stock Charting Software.
We must tell you that the most advanced stock charting software is based on Artificial Intelligence (AI) and not only show you the market movements but also come with extra perks such as:
- Customizable features
- Drawing tools
- Offer months of trading history
- Extended time-frames
- Mobile-friendliness & Access
You may like: 10 Best Demat & Trading Account In India
10 Best Stock Charting Software
So, let’s present you the list of the top 10 Stock Charting Software:
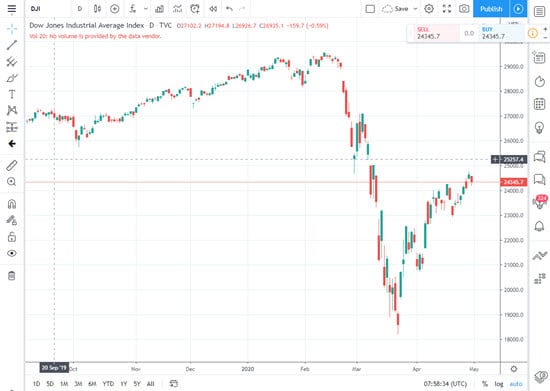
1. TradingView Online Charting Software
TradingView is particularly made for day traders. It allows you to view between one and monthly timeframes. It offers a clean and flexible way of analyzing stock charts with its latest web code, HTML5. Its HTML5 charts are known to load quite fast.
This minimalistic charting software goes on to save your CPU resources, thereby allowing you to do more at any given time. Although it’s not a highly advanced system, it still works out to be an excellent platform for accessing, especially on-the-go.
With HTML5 capability, TradingView is also extremely easy to access on the phone. The company’s app (for iOS users) is one of the best on the market. You don’t need to sign to access them.
It has all the basic features such as 1D – 5Y time frames, zooming tools, drawing tools, and so forth. Plus, it has a thriving social media component. It allows you to view multiple charts on the same screen for comparison.
TradingView offers a basic freemium model. However, you can upgrade if you want to access more in-depth features.
Highlights:
- No software download needed
- The charts load fast and are also not resource-intensive
- The charts are available at absolutely no cost
- It comes with a bunch of features such as drawing tools, etc.
- It’s available for free
- Excellent mobile app
2. AmiBroker Stock Charting Software
AmiBroker is one of the best stock charting & technical analysis software on the market. This ultra-fast and powerful exploration tool allows you to scan the market for opportunities and inefficiencies. It turns out to be your defining edge for staying ahead of the crowd.
With AmiBroker, you can define objective entry & exit rules. It allows you to use Portfolio-level Backtesting & Optimization for fine-tuning the performance. You can trade visually from Charts. You can even use its Analysis tool for generating order list.
Plus, you can place orders directly from your code by using its Auto-trading interface. So, with AmiBroker, you can upgrade your trading to the next level.
You get all the information at your fingertips with its powerful, easy-to-use, and beautiful charts. One can drag-and-drop averages, bands, and indicators on other indicators. You can even modify parameters in real-time with its sliders and can customize with many different styles & gradients for making them beautiful.
AmiBroker offers one of the world’s fastest portfolio backtesting and optimization. It also comes with other sophisticated features such as advanced position sizing, scoring, and ranking, rotational trading, custom metrics, custom back testers, as well as multiple-currency support. It allows you to automate your routine with its newly integrated Batch processor. You can run it from the Windows scheduler.
AmiBroker prepares you for difficult market conditions. You can check worst-case scenarios and the probability of ruin. You get an insight into the statistical properties of your trading system. Its flexible user interface can be arranged and customized the way you like. It fully supports multiple monitor setups. Plus, it comes with many powerful tools for the system trader.
Pricing:
- Standard Edition – $279
- Professional Edition – $339
- Ultimate Pack Pro – $499

3. StockCharts
StockCharts is known for its sharp charts, which are visually very impressive. It’s a free service that offers excellent Point and Figure Charts. It’s a simple, clean, and overall scalable free stock charting site.
It offers several free tools as well as ways for analyzing any stock chart desired. StockCharts allows you to create candlestick charts as well as line and bar charts. So, it has all the charts, tools, and resources for investing more strategically and profitably.
Its award-winning charting tools and advanced analysis resources allow you to invest better and smarter. In simple words, StockCharts makes investing easier for you.
With StockCharts, you can see the markets more clearly. You can improve your portfolio management and can find out promising new opportunities faster than ever before. It’s trusted by thousands of online investors across the globe.
StockCharts allows you to easily create the web’s highest-quality financial charts with a few simple clicks. You can come up with advanced charts and save them to your account.
It offers the opportunity to run custom scans for finding new trades or investments. You can even set up automatic alerts for addressing your unique technical criteria. Moreover, there’s daily market commentary from industry-leading experts. Plus, you can see the latest charts they’re watching.
StockCharts puts the industry’s best technical tools & resources at your fingertips. There’s no software to install either or frustrating compatibility issues. It allows you to access everything in your account seamlessly from any web-enabled device.
So, StockCharts is a complete investing system. It works out to be a complete analysis and portfolio management toolkit. And when you want to sell, it’s custom technical alerts are available for you for timing your exits like a pro.
Pricing: Starts at USD 14.95 per month (Basic Plan)

4. Google Finance
Google Finance is a great place for doing a thorough research and learning about stock investment strategies. It offers a large volume of stock quotes as well as financial news allowing you to explore your different investment options before investing your money.
So, Google Finance can help you reach your financial goals. It shares immensely useful information on thousands of companies. It also offers an excellent portfolio tool.
In its sidebar, there’s a section called World Markets. It allows you to see how stock markets are performing in other countries. There’s also a Currency section, where you can come to know how various currencies stand up against each other.
It even lists down Bond yields. There’s a Sector Summary where you can come to know how various industries are performing on a global scale.
It lists down important stock information like the P/E (Price-to-Earnings) ratio from which you can come to know whether a stock is overpriced or not. You also get other vital information, such as market cap and volatility. It offers a terrific overview allowing you to make wise investments going forward.
So, with Google Finance, you can get lots of information all in one convenient place. You can see the price of each stock, its movement, as well as its market capitalization, volume, together with low and high prices for the day.
When you view a stock, the first number offered is the current price. You can also come to know how the stock has changed throughout the trading day. One can get the low and high of the stock for the trading day.
You also come to know how much the stock has changed over the past year or 52 weeks. It’s a great way to know the volatility of the stock over the long-term.

5. TC2000 Stock Charting Software
TC2000 offers stunning charts, all US stocks & options together with dozens of indicators, as well as streaming data, option chains, and even free practice trading. When you go on to download TC2000, you get the option to select its free version.
This free service offers more than 80 stock chart indicators, which can be applied to the chart. It has all the popular ones out there. Plus, it comes with different bar types such as Japanese Candlesticks as well as Open, High, Low, and Close OHLC.
You can even plot trendlines on the price data as well as on all the indicators. This can be a very valuable aid when you do technical analysis. They offer drawing tools and allow you to use Fibonacci Lines, Fibonacci Fans as well as Fibonacci Arcs.
Moreover, its user interface is super easy and effective. However, you need to sign in for accessing your watchlists.
So, TC2000 turns out to be a great stock charting package with:
- Candlesticks and OHLC
- The ability for plotting Trend lines on price as well as on all the indicators
- Variety of indicators
- Integrated portfolio management
- Good user interface
- Watchlists
- Free mealtime streaming Price & Volume
- Intra-day 1 minute/1 year per bar
- Fibonacci Lines/Arcs/Fans
- The charts are real-time
- Built-in social and chat feature for sharing charts with friends
- Its premium version comes with a built-in stock scanning system
Pricing starts at $9.95 per month wherein you get a full suite of excellent features as well as the end of day data.

6. Investing.com
Founded in 2007, Investing.com proves to be an ultimate source that offers tools and information related to the financial markets like real-time quotes, streaming charts, latest financial news, technical analysis as well as brokers’ directory & listings, tools, and calculators and an economic calendar.
The site has offered in-depth information on Currencies, Indices & Stocks, Commodities, Futures, and Options, as well as Rates & Bonds. It has been successful in earning a growing readership worldwide.
In fact, Investing.com has become a leading global financial portal that is dedicated to providing innovative features and sections, thereby proving to be an optimal one-stop source for its readers.
It has come up with mobile apps for Android as well as iOS that provide news, charts, analysis, technical data, and financial tools with respect to global financial markets. It has offices in Madrid, Nicosia, Tel Aviv, and Shenzhen.
Investing.com currently offers 33 localized editions in as much as 22 languages, including Chinese, English, French, German, Greek, Japanese, Korean, Swedish, Russian, Thai, and much more. It offers extensive free data, news, information, analysis, and tools for the Forex market for traders.

7. Yahoo Finance
Yahoo! Finance was started shortly after Yahoo!’s debut in 1994. As of now, Yahoo! Finance has become the industry-leading business and financial news product.
The service not only spans desktop origins but also utilizes mobile and tablet apps. It has come out with a stated mission to help users make well-informed decisions in the investments and financial markets.
It dishes out financial data as well as offers a wide array of applications, thereby helping users to obtain detailed as well as current market information.
Yahoo! Finance is on the simplistic side when it comes to features and aesthetics. It allows you to filter your charts based on different technical indicators, which proves extremely useful. You can come to know stock movements for up to five years in duration. It also offers several comparison charts at the same time.
In the spring of 2019, Yahoo! Finance upgraded its entire charting experience. Now, it offers clean HTML5 charts that are clear and easy to use for everyday investors.
Plus, it turns out to be an excellent resource for stock quotes, news, and research. It has 114 different technical indicators. Its interactive charts allow you to draw linear regressions, trendlines, as well as quadrant lines. It even provides real-time quotes as well as charts through the BATS system.
Moreover, Yahoo! Finance has been quite innovative in its offering. It allows you to trade stocks through its Yahoo Finance charts. It has partnered with Trade.it that can transport trade requests to the mainstream U.S. brokers.
Price: You can have a subscription to Yahoo Finance Premium for $34.99 per month.

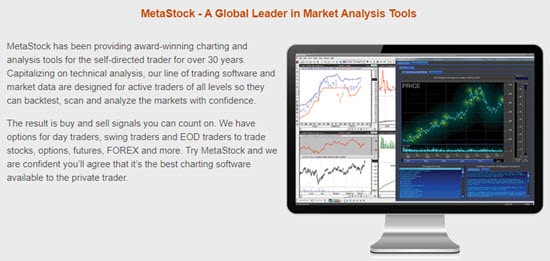
8. MetaStock Stock Charting Software
MetaStock is a recognized player in market analysis tools. It has been dishing out award-winning charting and analysis tools over the last 30 years for the self-directed trader. Its line of trading software capitalizes on technical analysis and facilitates active traders to backtest, scan, and analyze the markets with confidence.
These results in buy and sell signals that you can count on. It has come out with options for day traders, swing traders as well as EOD traders for trading stocks, futures, options, FOREX, and more.
So, MetaStock comes out as one of the best charting software for private traders. It offers clean and accurate market data that you can count on. It has been designed for traders to analyze the markets. Its technical analysis capabilities help traders to take the guesswork out of trading. It offers a methodical, systematic approach helping traders to select securities for trading.
At the core of MetaStock lies PowerTools, which are professional-grade analysis tools for private traders. These tools come with pre-built systems that help you to find pre-defined patterns in the stock market.
For instance, it includes:
- The Explorer: It can scan the market and filter out securities that go on to give buy or sell signals based on your criteria.
- The System Tester: It tests out most strategies through a process known as Backtesting, allowing you to see how your strategy would have worked out over time.
- The Expert Advisor: It generates a buy or sells signal, which is based on the criteria of the system that you have selected.
- The MetaStock Forecaster: It allows you to set more precise stops and profit targets.
9. eSignal
eSignal combines all the good stuff that you expect in charting software. It provides you with six months of intra-day trading history. Plus, you can also access historical data from twelve months gone by. Its biggest highlight is that it provides you with unlimited editing and coding freedom.
Moreover, it comes out as a standalone charting platform. They even provide you access to t 50+ brokerage firms. So, you never have to leave their interface for looking at a broker. It has the most dynamic charting tools around. For instance, their drawing tools can identify trends and pinpoint support and resistance spots for you.
Other cool stuff with eSignal includes:
- Comes with a whole lot of customization features
- User-friendly interface
- Offers in-depth intra-day historical data
- The highly advanced technology used
- Access to more than 50 brokerage firms

10. Chartink
Chartink.com comes with tools for technical as well as fundamental market analysis. They provide several tools that come free of cost, such as:
- Candlestick & PnF Charts
- Custom Stock Screeners
- Intraday Charting & Scans
- Stock Watchlists
- Historical Price Data Back to 1980
- Large Charts
- Accurate data directly from Exchange
- Point & Figure Charts
- NSE BSE EOD Charts
- Live NSE Charts
- Live Charts
- Moreover, much more
It also comes with a premium subscription for the Scan alerts. For further info, you can check Chartink.

So, we have shared with you stock charting platforms that are available free of charge as well as those that charge a premium.
These are the platforms that allow you to access awesome charts out there. You can make use of these charting services to gain fundamental knowledge about the financial markets so that you can come out with wise decisions and profit from trading activities.
We hope that this post is immensely useful to you and allows you to gain a better understanding of the financial landscape.
Thanks for visiting.
We welcome your comments and suggestions. Lastly, please do share the post across popular social network channels.